What is the Ishikawa Fishbone Diagram?
The Ishikawa Fishbone is a Cause-Effect Diagram that helps to find the Root causes of any type of Problem.
- It is known as the Fishbone Diagram because of its resemblance to a Fishbone.
The different causes originating a Problem have been traditionally classified into 6 different Activities:
- Material.
- Measurement.
- Machine.
- Method.
- Environment.
- Employees.

Ishikawa Fishbone Diagram.
Since the Ishikawa Diagram was born in an Industrial Environment, the original categories employed are obviously Industry-related.
Nowadays, however, there are multiple Economic activities that would hardly fit into this categorization.
Thus, after explaining the main components of the Ishikawa Diagram , we’ll give you examples that use very Different Factors.
Components of the Ishikawa Diagram
This Fishbone Diagram is based on 3 Components:
- The main Activities and Inputs involved in defining a Product or System.
- The Issues you observed within in these Activities and Inputs.
- The Problem you want to fix.
Of course, there can be ramifications, connections between branches…
You can develop the diagram as complex as you want, but its essence is based on these 3 principles shown.
1. Activities and Inputs

The Activities involved in the Creation of the final Product.
As we mentioned before, it depends on the product, its Customization, the Raw Material employed…
All the relevant Activities and Inputs affecting the final Product’s characteristics and quality should be considered here.
The traditional Activities and Inputs are:
- Raw Materials:
- Whatever you use, supplied by an external Company.
- Process:
- The activities you carry out, in order to transform your Raw Materials into your final product.
- It is better describing it as “Process” rather than “Machine”, since this way, you can cover more aspects.
- People:
- Everybody involved in every Stage.
- Method:
- It is what defines the Process and How it should be carried out.
- Environment:
- Certain problems appear at a certain time, weather conditions, etc.
- Measure system:
- How you Measure and Check Quality essential.
You can use the Input or Activity that best suits your needs, but it would probably be related to one of these generic concepts in one way or another.
2. Issues observed within

As its name suggests, here, you must list down all the Issues found within the corresponding Activity.
- That may have relation with the “big Problem” you are trying to solve.
Sometimes, it is difficult to know which small issues are related to the “big Problem” you want to solve.
- Generally, the more difficult a Problem is, the less intuitive its solution will be.
Start with the obvious ones, and move on.
You can branch these issues in very different ways.
But, usually, they are grouped by:
- Frequency:
- How often these Issues take place. Hourly, daily…
- Sub-Activities:
- Which sub-area is experiencing these Issues.
- The relation with other Activities or Inputs:
- Whether there is a proven relation with other areas.
We will give you different Examples that will help you understand this Tool much better.
3. Problem to be solved

This is what you are trying to Fix or achieve.
As mentioned before, this Diagram can be used with different purposes.
Sometimes, it is used to solve a Problem.
- Other times, it is used to Achieve Something.
Now, we’ll give you 3 examples to help you understand how to develop an Ishikawa Diagram:
Examples of Ishikawa Fishbone Diagrams
We have chosen 3 examples of Situations in which the Ishikawa Diagram can be of great help.
- These examples are not related to Industrial Problems.
* You will find all these examples in our “Planning Templates” Page, in a Word document that may be useful for you to start building your own Ishikawa diagrams.
Let’s begin:
Blog - Example of Ishikawa Fishbone Diagram
In this example, we’ll imagine that you have a Blog.
You enjoy writing and improving it, but your Monetization is very poor.
That is why you decide to use the Ishikawa Diagram:

Ishikawa Diagram Example – A Blog.
As you can see, what initially seemed to be a monetization Problem, happened to be a lack of attractive Topics.
What we propose is:
- Maintaining your current structure, Find new Topics by analyzing User behavior.
- Do they like Long Posts or Short Posts?
- Do they follow the Trends you talk about?
- What are they commenting on your Blog?
It is impossible to monetize a Blog if the Users are not enthusiastic about what you are talking about.
SEO - Example of Ishikawa Fishbone Diagram
Now, let’s imagine that you own a Website.
The Problem you have is that, this Website is not Ranking Properly on Google.
- In case you don’t know, that is called a Bad SEO Positioning.
Therefore, you decide to develop an Ishikawa diagram in order to study all the different factors affecting its positioning:

Ishikawa Diagram Example – SEO.
Improving your SEO is a difficult task that requires lot of effort and time.
- This Fishbone diagram could be 2 meters long, but as a first step, this approach would be very helpful.
It seems that you have been having fun writing Pages and posts, but you din’t take enough care about Focusing on a certain Topic or about organizing the Site.
We could suggest:
- First of all, organize all the Website.
- Having broken links, empty pages… Punishes your SEO positioning.
- Focus on a certain Topic.
- Improving your Posts’ authority.
- Deepening the Topics most valued by Users.
- Employing more time when writing the Posts.
- Building Backlinks.
- Once successfully accomplished these suggestions.
By doing this, it would improve its positioning considerably over the weeks.
e-Commerce - Example of Ishikawa Fishbone Diagram
Finally, we’ll imagine that you own an e-Commerce Company that is having a Profitability issue.
Although you have sales all around the world, you feel that all this work is not being profitable enough.
That is why you decide to use the Ishikawa Diagram:
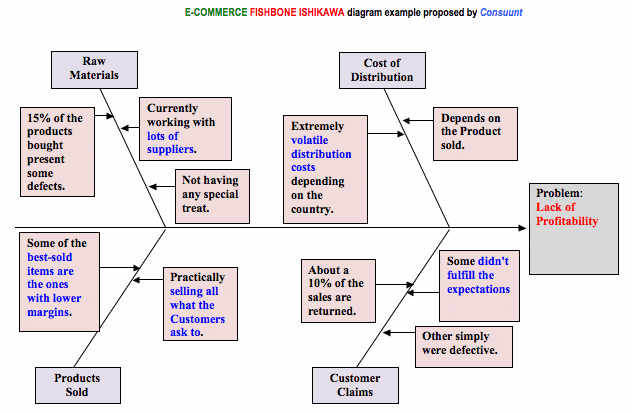
Ishikawa Diagram Example – e-Commerce.
This is a very common situation:
- People get so excited when starting a Business that they don’t care about Margins or Profitability.
At first glance we can see which are the Problems:
- This company is selling whatever the Customers are requesting.
- The Market is buying Low-margin Products while the company is doing nothing to solve it.
- Customers are not receiving what they expected.
- This is causing a mess regarding the distribution costs.
If you don’t design any Strategy for your Business the market will do it for you.
- And be sure you’ll be “squeezed” in few weeks, months or years.
We propose:
- Stop selling Low-Demand Low-Margin Products.
- The last thing you want is getting a terrible Brand name.
- For High-Demand Low-margin sales, establish a Strategy for selling High Margin Side-Products.
- If the market is requesting a product with poor Margins, try to promote complementary products with higher Margins.
- Remember the famous Popcorn example:
- Theatres have low margins but, they make money by selling Popcorn.
- Reduce the Number of Suppliers.
-
- Get rid of the worst -Quality Suppliers.
- By centralizing certain purchases, establish a long-term relation with your best Suppliers.
-
- Centralize the sales and establish a close relation with 2 companies.
-
- You always would need a backup, don’t reduce your options to just a single company.
-
What you must remember about these 3 examples is:
- List down all the issues you find in the areas involved.
- Link them together.
- “Read” which may be the core of the problem.
- Start taking actions for solving the issues found.
You will not solve everything at once, but if you acquire this work dynamic, you will experience amazing improvements in a medium period of time.
Summarizing
The Ishikawa Fishbone diagram is a useful tool for analyzing what is causing a problem and how this problem can be solved.
It is based on 3 main components:
- Activities and Inputs.
- Issues observed.
- Problem to be solved.
Regarding the “Activities and Inputs”, there are 6 generic areas commonly taken into account:
- Material.
- Measurement.
- Machine.
- Method.
- Environment.
- Employees.
Depending on the project you are analyzing, you can alter them in order to better describe your economic activity or the problem you are trying to solve.
This tool should be employed regularly when solving important or repetitive Problems.
- By doing so, you’ll improve your Problem Solving skills by getting used to think constantly in a multi-variable way.